Metrics and dashboard
The metrics dashboard gives you a snapshot of the business: revenue and expenses, margin, staff cost and a comparison with the previous period. It’s meant for admin and manager.
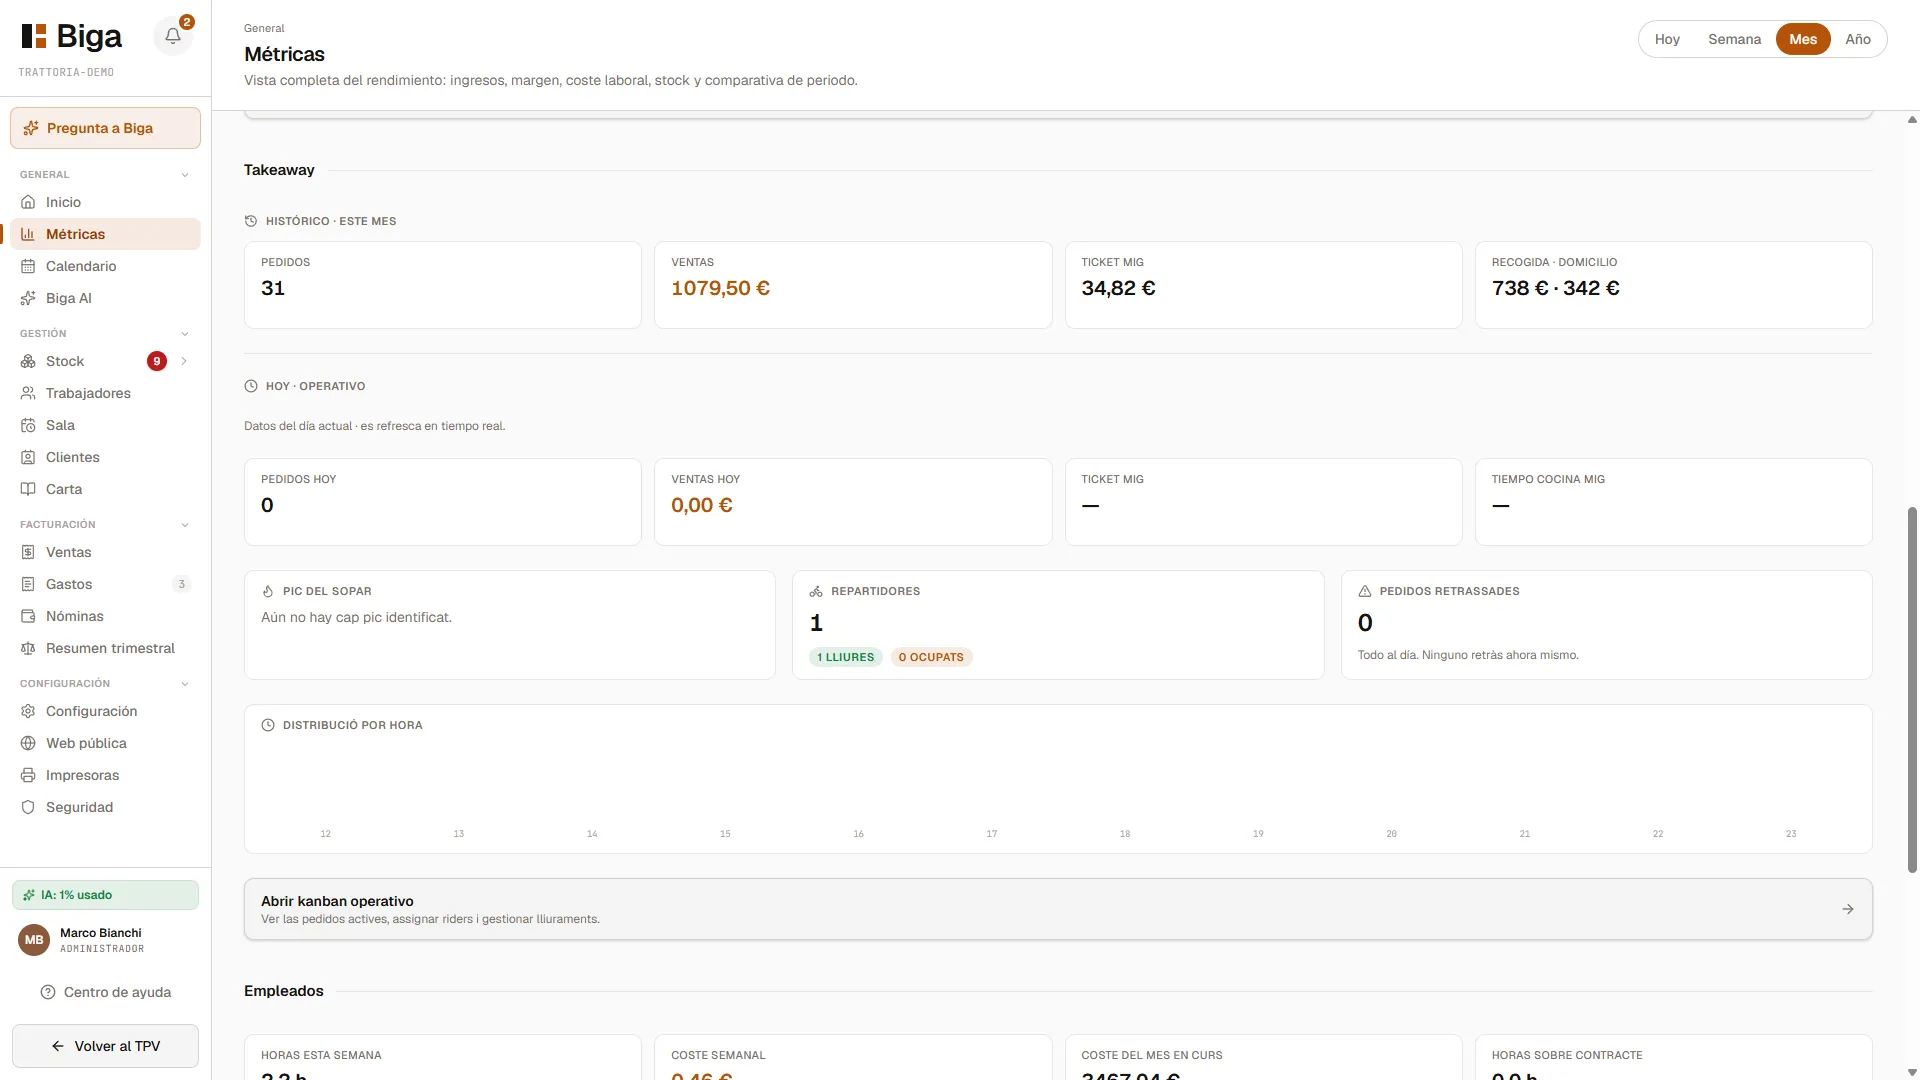 Revenue, margin, labour cost and period comparison in a single view.
What you’ll find
- Revenue for the selected period, with a comparison against the previous period.
- Margin and cost of goods (based on the recipe costings).
- Staff cost for the period.
- Trends by day and time slot (to spot the busiest moments of service).
The dashboard doesn’t show inventory. To see the stock level of your ingredients, go to Delivery notes and stock.
Choosing the period
At the top you can pick the period (today, this week, this month…) or a custom range with the date picker. The whole screen updates to the selected period.
How to read it
- Always compare against the previous period (the arrow and the percentage tell you instantly).
- Keep an eye on the service peak to size your staffing.
- The margin drops when the cost of goods goes up: review your recipe costings and purchase prices.
Common issues
- I see figures at zero → check that there are sales in the selected period and that the date range is correct.
- Staff cost doesn’t show up → you need to have logged the hours or the contracts under Staff.