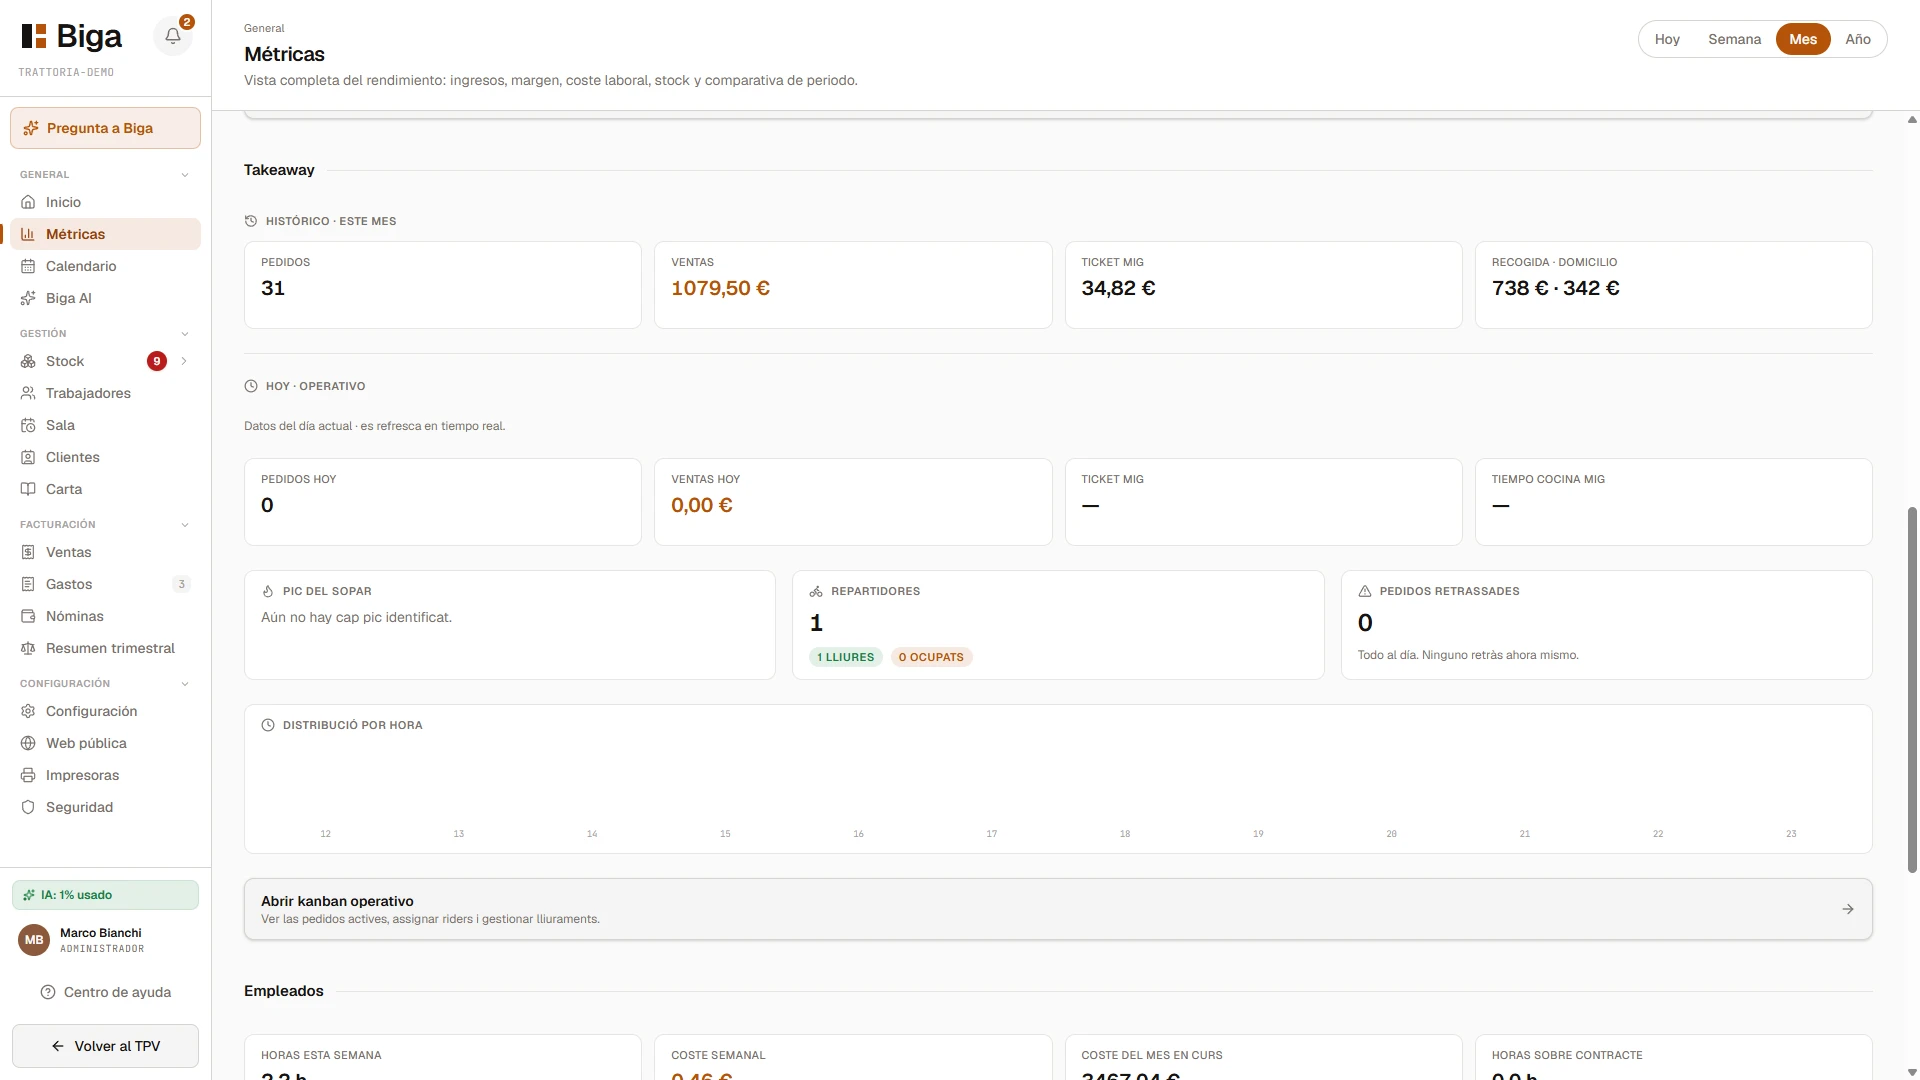
Revenue for the day, the week and the month. Which dishes leave a margin and when you're busiest. All worked out on its own from your real orders, in charts you grasp at first sight.
The recreation above shows it in motion; this is the real back-office screen, with the restaurant's numbers —orders, sales, average ticket— worked out on their own from your sales. No spreadsheet in between.
Open the dashboard and you already have the picture of the business: how much you've made today, how the week and month are going, and how it compares with before. No reconciling tickets by hand or exporting anything.
A time chart of your revenue with the breakdown by channel and by category. You see trends, comparisons and which days work — without putting together any report.
No spreadsheet. No report by hand.
The numbers are already there.
The ranking of dishes by revenue and by quantity. You know what's popular, what's worth pushing and what doesn't pay off — to decide the menu with data, not by eye.
You can try it in your venue with your own data. No lock-in, no commitment and with assisted migration from whatever system you use right now.